
Several sellers have noted a pattern with their analytics dropping significantly (approx 50%) in mid Feb 2022. We’ve been investigating this for some time, and can now share our findings.
Short version: this doesn’t reflect a reduction in attention for your domains, but changes to our methodology and the design of our website. Overall sales have increased during this time.
The long version is complicated, and we’ll explain it below.
Detailed explanation
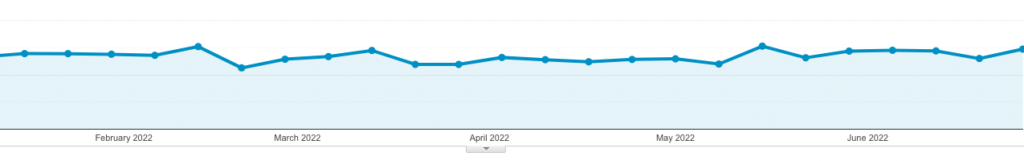
Brandpa’s overall popularity has not fallen during this time, as shown by independent Google Analytics data for the first half of 2022:
However the number of views reported for individual domains – what we show our sellers in our dashboard – fell approximately 60% on 26th February, rising around 9th May:
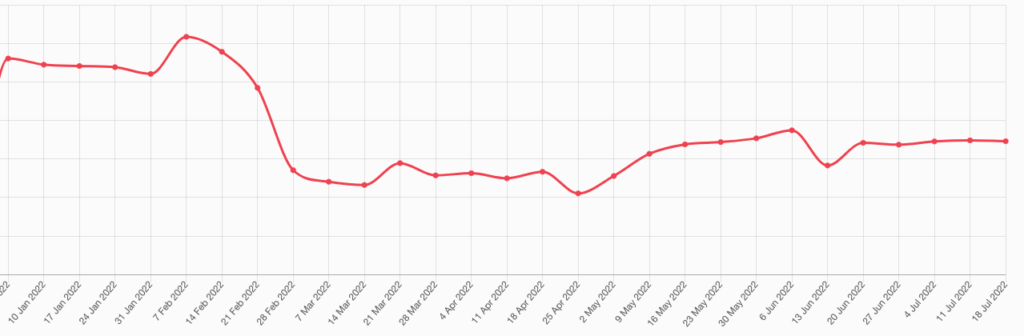
We can safely assume Google Analytics’ data is correct. The domain views is recorded by our own analytics technology, which completely changed on 26th February. That happens to be the exact time those figures fell.
So the obvious conclusion is “something is wrong with our new analytics”. But complicating this: we also launched a redesign of Brandpa on the same day.
An earlier investigation had revealed that we were showing the average visitor fewer domains per page view. Our website redesign had more white space, and larger domain logos. These looked good, but they meant fewer domains were shown per-page, and so the individual domain views had fallen, even as we had the same number of visitors.
On 9th May 2022 we launched a redesign to fit more domains into less space, which resulted in the ~30% increase in views you can see above.
This didn’t restore numbers to where they once were however. We have since considered a wide range of extra factors and have concluded the following:
- There aren’t any faults we can detect in the collection of our analytics data.
- We no longer support analytics for Internet Explorer, but this is a tiny fraction of our overall visitors (0.5%).
- Changes to our design still reduce the average number of domains a user would see, relative to our old design.
- However, this hasn’t negatively impacted the odds of them finding or buying a domain. Sales-per-domain have increased during this time. Some pages, like our homepage, may get a lot of ‘casual’ views but they are less likely to convert. Views inside search are more valuable.
- Our redesign reduced the number of domains shown per page from 200 to 80. We were able to show that this reduced the number of domains an average visitor would look at, presumably as they had to move manually between pages more, and have increased this limit back to 200, effective today.
- Our redesign split the name and price onto two lines. This change reduced the number of domains viewed. We’ve changed this back, effective today:
Old design:
New design:

- There are some fundamental changes in how our newer analytics excludes bots from our data. These changes make our data more accurate, but they have reduced the amount of traffic domains appear to get from 28th Feb 2022.
- Browsers and browser extensions like AdBlock are increasingly likely to block any kind of analytics, but we were not able to identify any evidence of this happening to Brandpa.
In conclusion: the number of views per domain we report to sellers has generally gone down since Feb 2022, but this has not negatively affected sales, or the popularity of Brandpa. In fact, we’ve seen an increase in STR and CTR during this time.
The way these figured were recorded has changed. Comparing stats from before and after the change is therefore difficult (like comparing old and new versions of Google Analytics).
This exercise has highlighted the tenuous relationship between raw views and sales. The pattern of most domain sales is simple: a lot of people may see a domain, but only a very very small % of them will be interested in buying it. Most sales come from people who are performing searches that show a specific domain, thereby indicating buying intent.
With this in mind we’ve started to break out the analytics we record, between search results and ‘promoted’ domains (e.g. those shown on our homepage, section pages, and so on). Once we’ve gathered enough data, we expect to incorporate this into our sellers dashboard.